May 4, 2026
Most News Is Noise
An essay identifying a real life example that most of what passes for news today is actually just noise and can be ignored.
May 4, 2026
Most News Is Noise
An essay identifying a real life example that most of what passes for news today is actually just noise and can be ignored.
3 min read
My expression changed when I read the CNBC headline below recently. Instantly, I knew that the calendar was soon to turn to the month of May.
 Image from CNBC
Really? “Under Trump”? And CNBC wants people to PAY for (see “Pro” highlight) for this kind if insight?
The expression “Sell in May and go away” was one of the first wall street cliches that I recall hearing, or learning about. According to Investopedia, this phrase originates from the historical underperformance during the summer months compared to the six month period of November - April. Note the word underperformance, as words mean something. Underperformance does not mean negative returns.
While the cliche is cute, it’s pretty easy to fact check the data and quickly you’ll see that this cliche, and the above mentioned headline, doesn’t hold any water. I submit that the data demonstrates that typically markets do gain in the summertime making this headline sort of a foregone conclusion.
I went back to the Great Financial Crisis with the first two graphics to show the results of 4 different administrations and two different parties in control.
The data shows that the “sell in May and go away” idea has been mixed at best and downright deceitful at worst: Since 2010, May and June were modestly positive on average, July was the strongest month, while August and September were slightly negative on average.
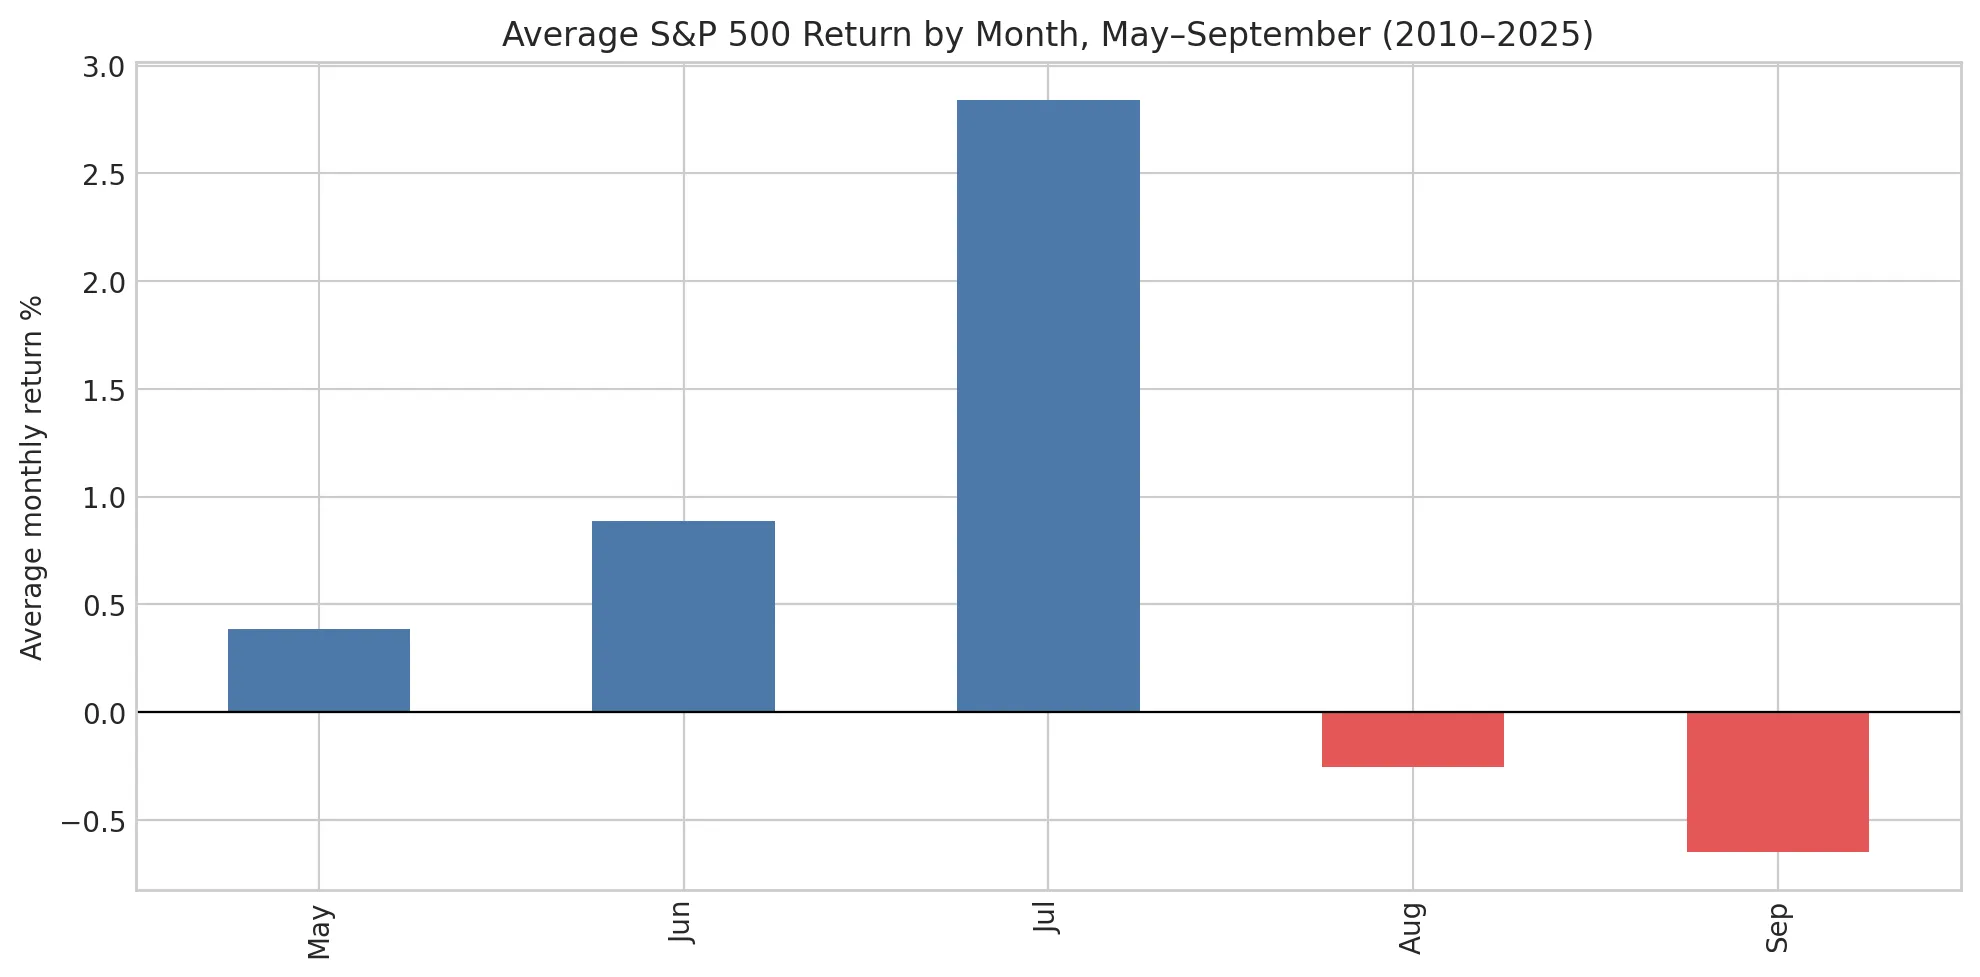 Graph by Perplexity on April 30, 2026
The only month without significant random negative swings is July. The two negative returns for July were pretty insignificant at -2.17 (2011) and -1.6 (2014). This heat map shows there aren’t any strong patterns to the returns.
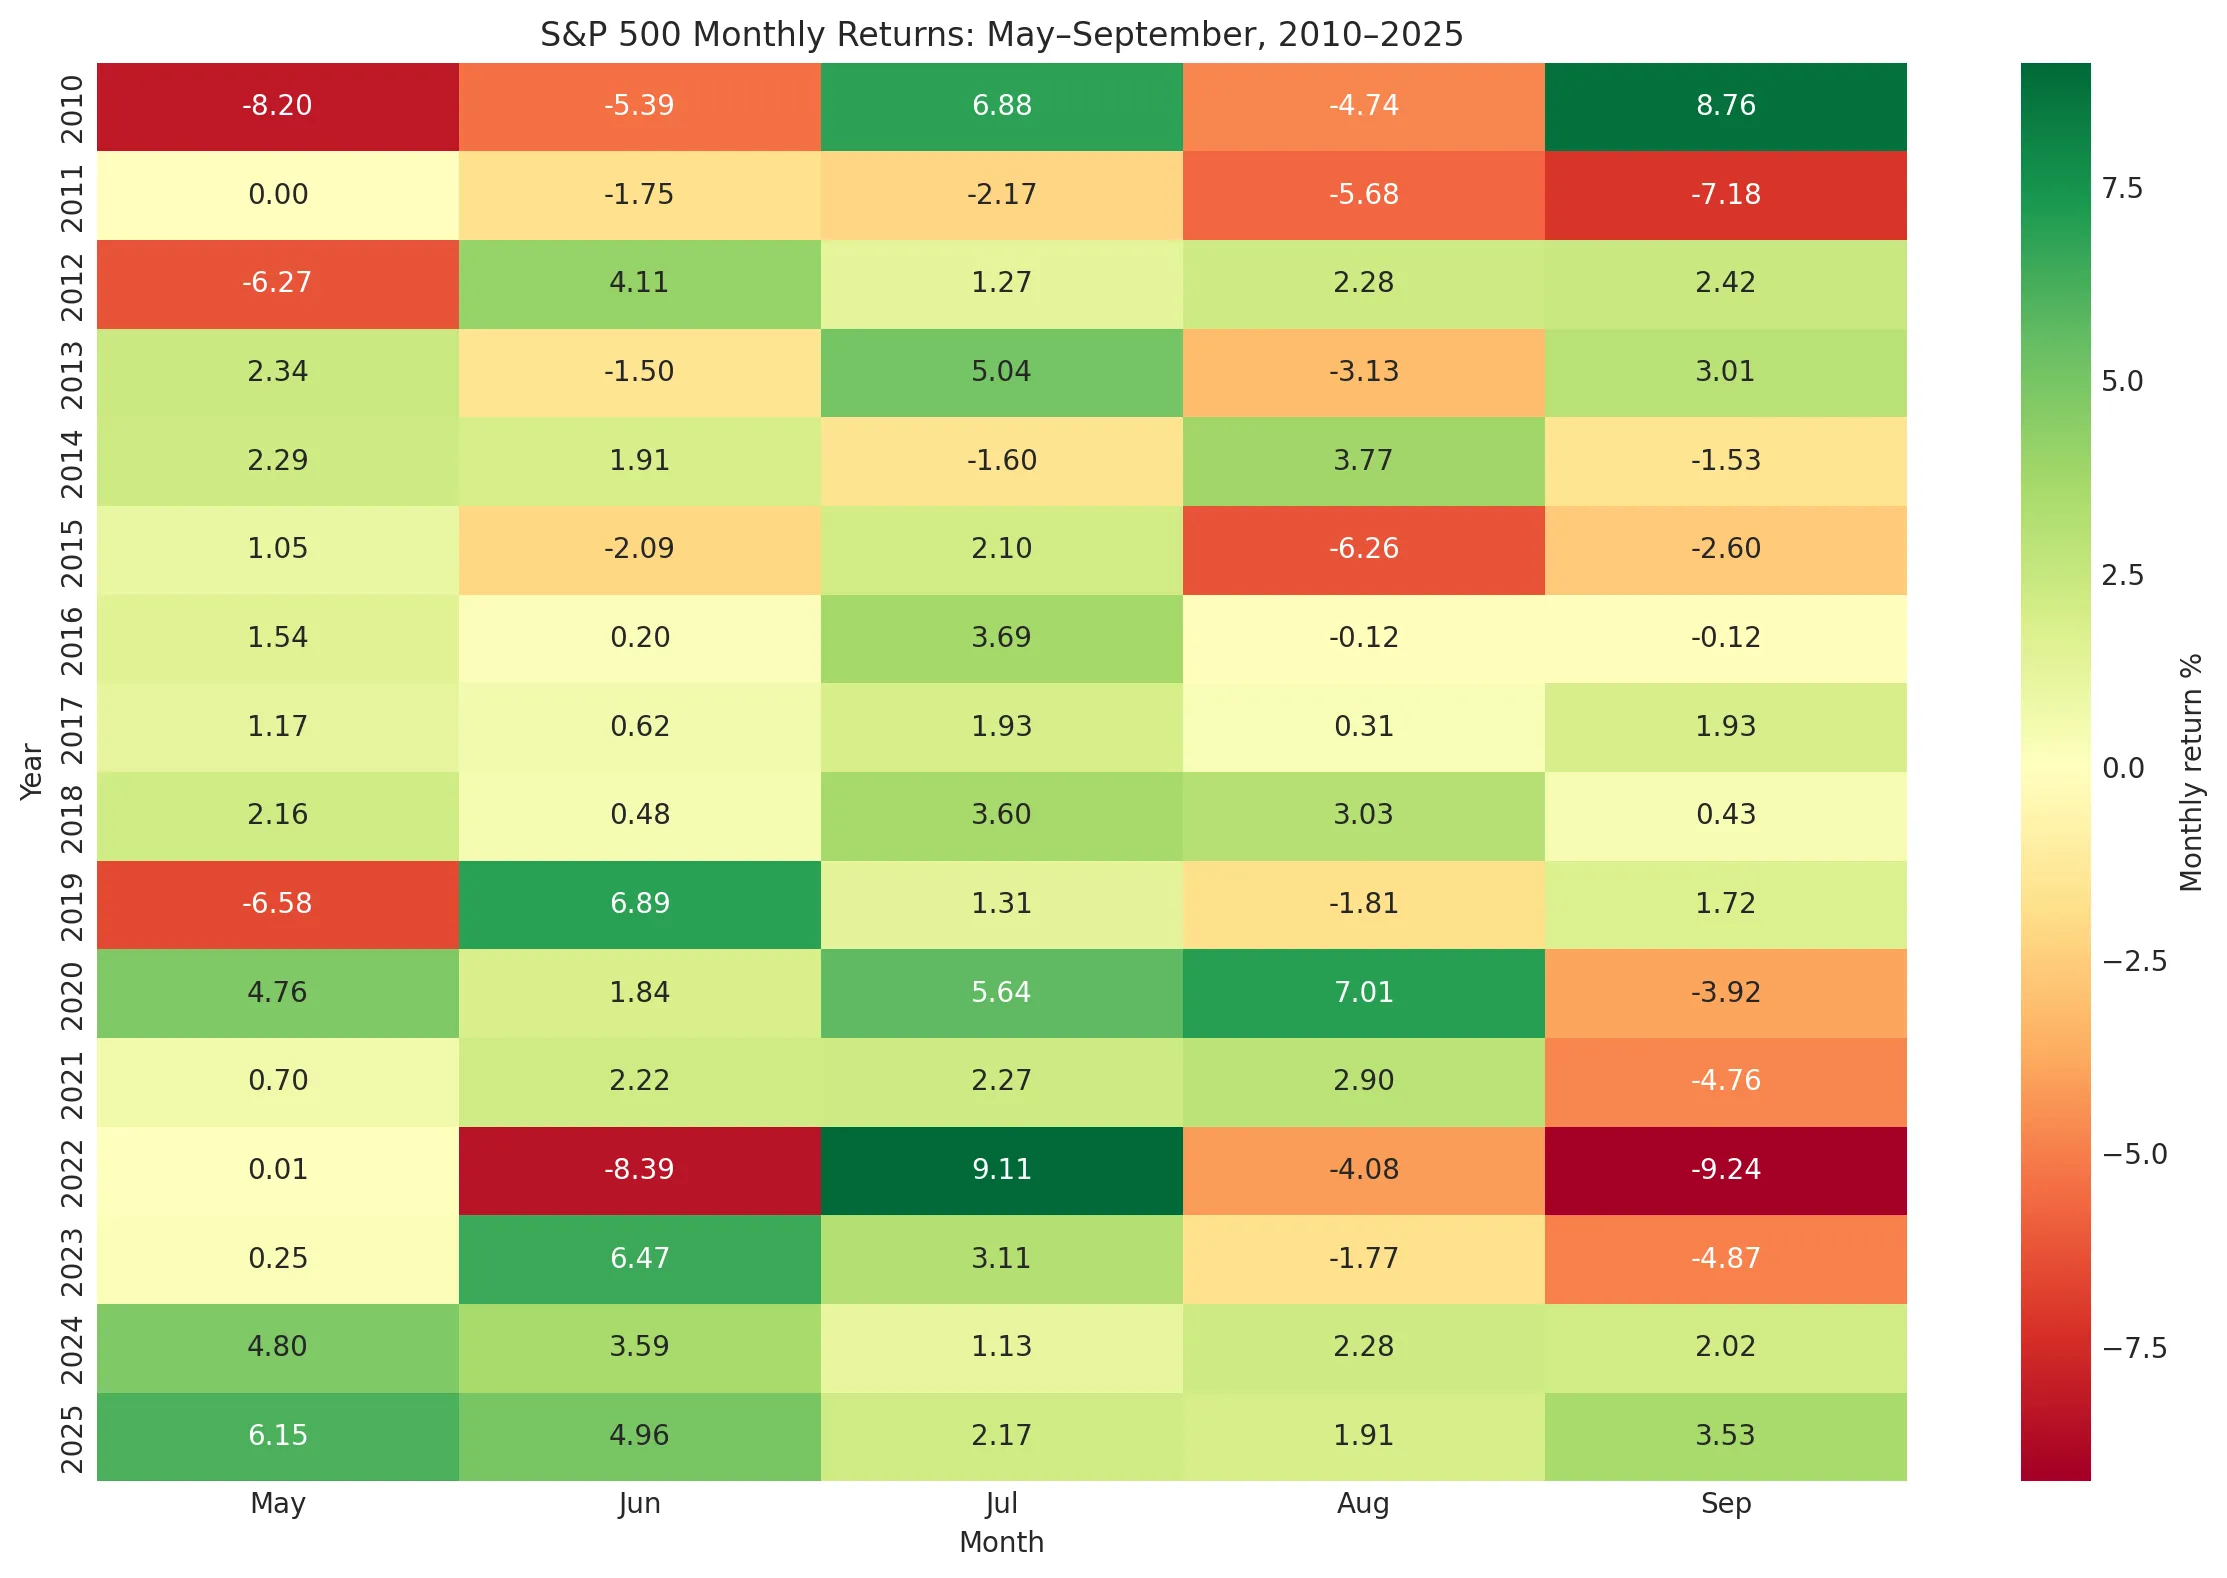 Grahp by Perplexity on April 30, 2026
I went back to 1950 with my last two tables to demonstrate that the outcome is identical with a larger set of data. The months November to April do stand out as the best contiguous months for average return. Even so, exiting in May and heading to fixed income for the next 6 months is leaving a lot of return on the table for the average investor. As they say, time in the market is better, or consistently beats, trying to time the market.
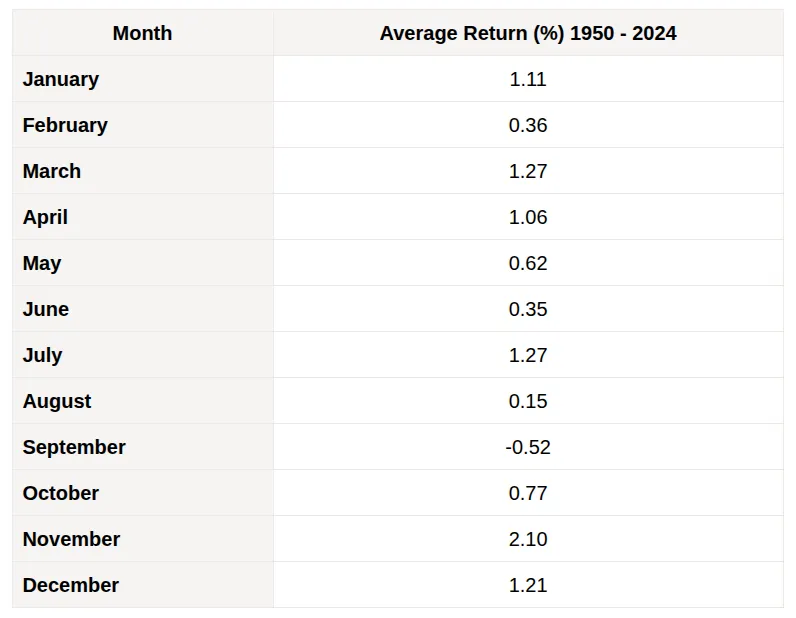 Graph by Perplexity on April 30, 2026, with most data sourced from Visual Capitalist
When you look at rolling six month returns of the S&P 500 from 1950, they all are positive.
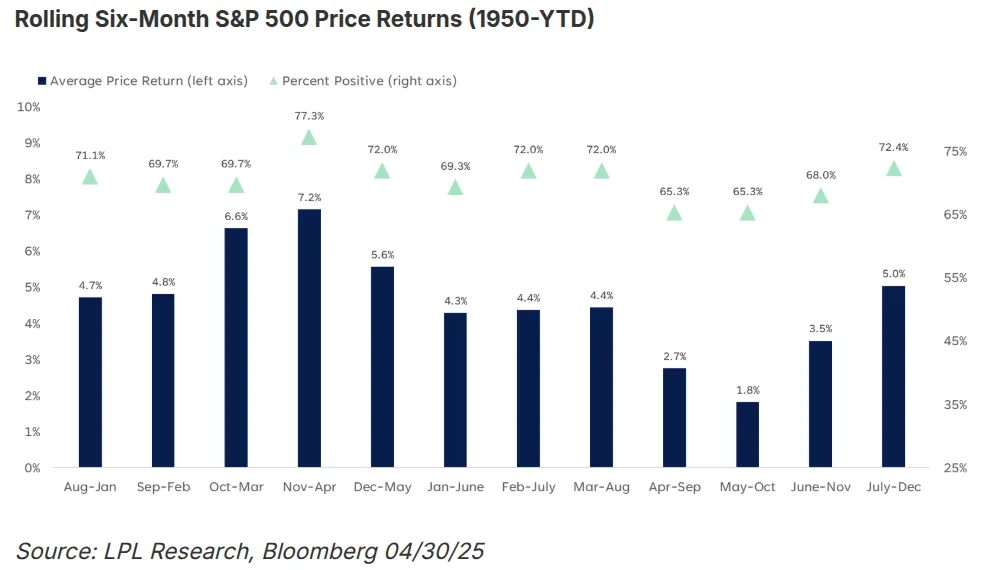
If the data doesn’t support the headline’s intent, I can’t imagine professionals reading, much less heeding, the supposed advice that this article dispenses.
Which just goes to show, you can’t judge a book by its cover (or an article by its headline) and that, in my opinion, most ‘news’ today is really noise and isn’t worth the time it takes to read it.